From Speccy to the M-set
Published
Speccy
My first computer was a Sinclair ZX Spectrum 48K, I like to call it Speccy. I will write about its hardware specification a little bit, here, because the context is really important to me.
Speccy had color graphics and its RF modulator output graphics to a TV set. There was a palette of 15 colors: There was black, of course, and seven colors at two levels of brightness. The screen was divided into a 32x24 grid where each cell can display a character. It was a 256x192 pixel display, you were able to turn a pixel on or off, but not set its color directly. All you could do was set the background and foreground color of a “cell”, 8x8 pixels. That was called an “attribute”. Memory was a scarce resource and this was how Speccy handled graphics memory. If you cannot imagine a display like that, don’t worry. Keep in mind that a desired color of a specific pixel cannot be set. This was called an attribute clash and was a limitation for games.
Verdict: Games for Speccy were not as good as competition’s: Commodore 64 or Atari.
I was fascinated by computer graphics, so, instead of going wild on games, I learned programming on Speccy and from day one I learned how to work with constraints. That single feature of Speccy’s graphics defined my life as a developer.
Personal Computer
Then came PC years. My first box had a Hercules Graphics Card. To cut a long story short, it had monochrome graphics but with a finer resolution of 720x348 pixels than the 320x200 or 640x200 color cards. I saved for a long time and eventually got a color graphics adapter with a color monitor. Real fun started for me. I typed all program listings from any PC-related magazine, experimented with anything I learned in math classes. I realized, back then, that I was not good at math but math was the basis of any graphics exploration. I remember drawing line graphs of trigonometric functions and their combinations while getting mediocre grades in the same subject in school.
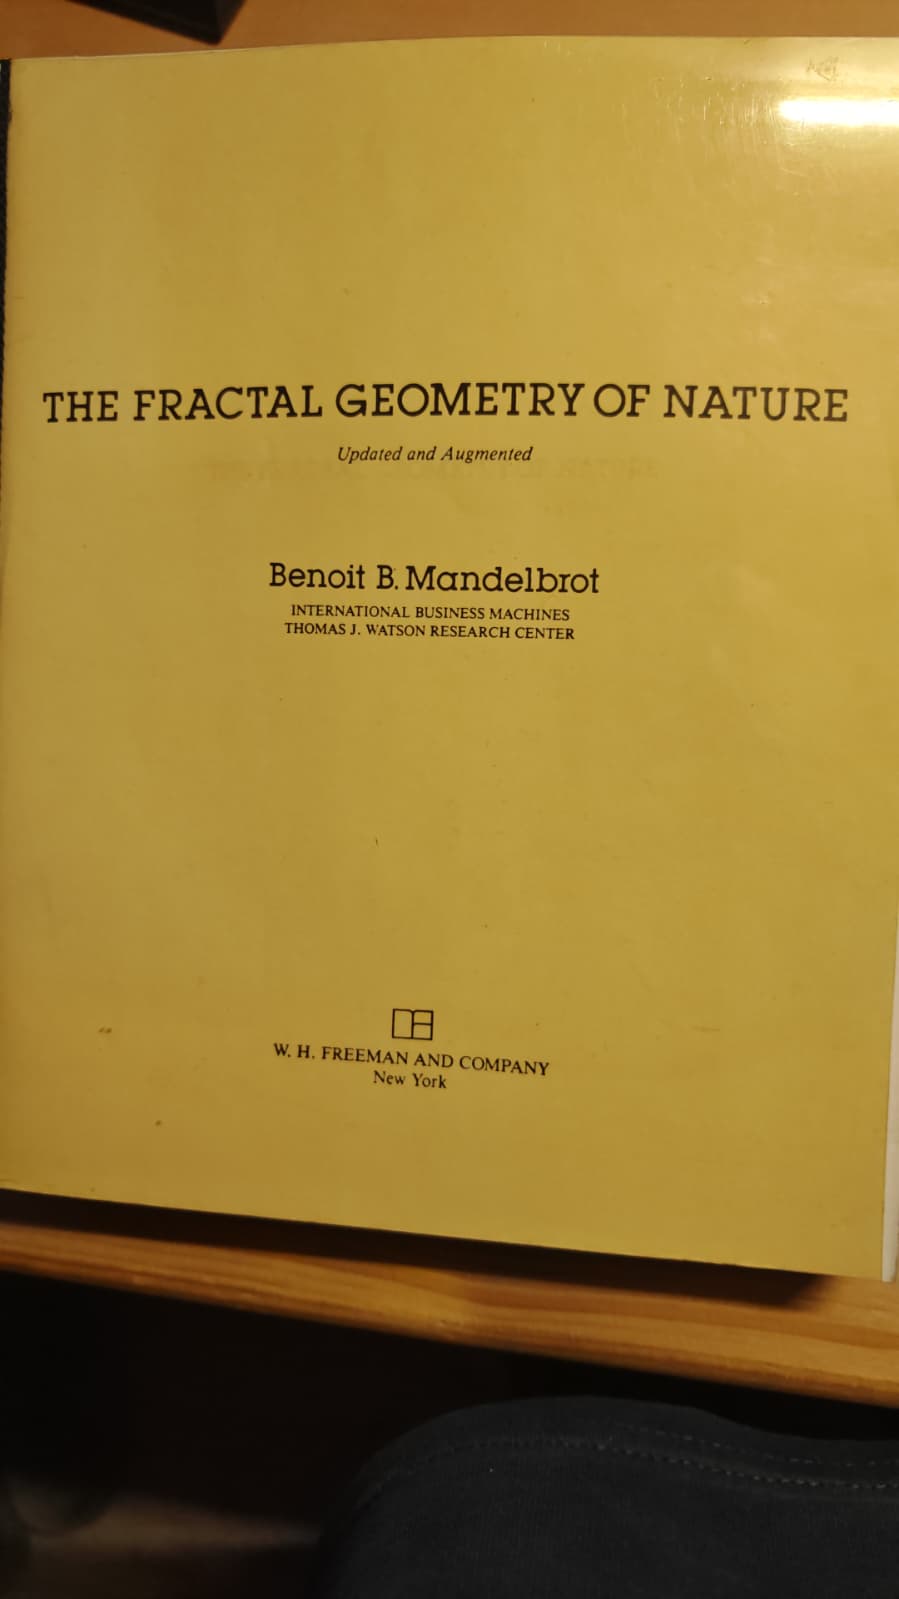
Then, I heard about fractals, specifically the “Mandelbrot Set”.
Benoit Mandelbrot
The Wikipedia entry for B. Mandelbrot is very good, recommended. You can also find a ton of information on the Mandelbrot set online. I will not repeat it here. Just be sure that even with 1994 standards of computer graphics, it was pure magic watching the endlessly repeating eddies, swirls and currents of color as you zoom in to different parts of the set and watch the structure from the zoomed out state emerge again and again after thousands, hundreds of thousands of iterations.
It was 1994 when I first coded the visuals for the Mandelbrot set. The set existed on the complex number plane. Here is a code snippet I wrote from a later Delphi source:
StepX:=(RealUpper-RealLower)/(maxx+1);
  StepY:=(ImagUpper-ImagLower)/(maxy+1);
  for Xpic := 0 to maxx do begin
    RealPart:=RealLower+(Xpic*Stepx);
    for Ypic := 0 to maxy do begin
      N:=0;
      ZR:=0;
      ZI:=0;
      Imaginary:=ImagLower+(Ypic*StepY);
      ZrSquared:=0;
      ZISquared:=0;
      repeat
        ZI:=ZI*ZR*2.0+imaginary;
        Zr:=ZrSquared+RealPart-ZISquared;
        inc(n);
        ZrSquared:=sqr(Zr);
        ZISquared:=sqr(ZI);
        if Self.Terminated then exit;
      until ((ZrSquared+ZISquared)>4.0) or (n>ppal);
      if n > ppal then n := 0;
      Map[XPic,YPic] := n;
    end;
    Map[XPic,-1] := 65535;
  end;
I already described how a CPU without a math-coprocessor struggled with sqr() and any other kinds of arithmetic in Fire Stations and the only fun part, probably.. The M-set was another example. Here you can see the loop, doing the calculations, over and over again. The graphics were beautiful. The generation was slow. One or two zooms are ok but if you really want to explore, another kind of magic was required.
The 1994 application was named M12C.EXE. The source didn’t survive. My AI agent dissected the executable and confirmed what my memory claimed.
Distributed Computing
Distributed Computing over the internet was the method how seti@home Your presence is required elsewhere dealt with mountains of data and the huge amount of compute required for analyses. I was working in a company, where some nights I had to stay in the office to help other employees, in another city, working at night, by sending them visuals, pictures from the company archives over a low speed modem connection. It was tedious work and there were long stretches of doing nothing.
I did not sit idle. There were computers all around me, nobody else (or very few) using them at night. So, I tasked them to calculate M-sets. Distributed Computing on a company LAN.
The 1994 DOS application did two distinct things, depending on how you run it. When it was in the role of displaying the M-set, it switched to graphics mode on startup, ran a similar loop like the above code piece, calculated the set, and displayed it. And did one more thing: it also checked the folder it is running in and looked for data files. Or, with another set of startup options, it did not bother with graphics at all. It computed the set and wrote the output to files.
I adjusted the number of applications running, the coordinates of the M-set I wanted to “look” at, all by hand. But the set appeared on the PC that was showing the graphics, quicker, almost linear gains proportional to the number of PCs I tasked. If this was a school assignment, work project or something I was building for someone else, I’d probably automate everything. I don’t remember doing that. What I accomplished was enough. The M-set in full color was reward enough.
Don’t get me wrong: I am not saying I invented the idea. This is just another case of “Necessity is the mother of all invention”. I didn’t know about the mechanics of Distributed Computing at that time. I just needed more than one computer generating my beloved graphics. I engineered it.
There are other code snippets showing that I also worked on creating PCX files. So that I could “export” the images generated by the application. Some other files, one especially named “movie”. I was literally trying to create videos of zooming into the M-set. In 1994. Check YouTube. There are many M-set zoom in videos. Mesmerizing content.
And something the agent puzzled over: A six-note sound generator was inside the executable, with pitch controls. I vaguely remember trying to “listen” to the M-set, by turning pixel colors to notes and trying to hear melodies, if there were any. Really, really wish I had the source. And if this all tickled you a bit, please check Arthur C. Clarke’s fine novel “The Ghost from the Grand Banks”. The master also was interested.
2003, Other Priorities
There is source code that survived from 2003, Delphi. It sets the graphics to 640x480. Coordinates -2.2 to 1.0 and -1.2 to 1.2. That is the full set, maximum zoom out, you can say. There is a separate thread that computes the pixels, the main thread draws as the picture appears from left to right. The novelty is mouse support: You do not put in the coordinates by hand into the executable, compile and run. You start with the whole set, and zoom in by drawing a rectangle on the image by using the mouse, and the new generation happens with the coordinates of the rectangle. Runs are timed and displayed. Aspect ratio is preserved so it is not a completely freehand rectangle. 4:3, just like 640x480. This version is not about Distributed Computing. Apparently, by 2003 the computer was fast enough, so I focused on usability enhancements, not compute. And the striking part is the color palette mechanics, the smoothing of how one color morphs into another as the iterations calculate the M-set. Here is the object definition of the worker thread, in Delphi:
type
  TMandelbrotSet = class(TThread)
  private
    { Private declarations }
    constructor Create(CreateSuspended: Boolean);
    destructor  Destroy; override;
  protected
    procedure Execute; override;
    procedure UpdateTime;
  public
    ppal : integer;
  end;
My AI agent asked, during the course of discussions on this piece, why I stopped in 2003. I don’t know. Maybe I did more but the source/memory didn’t survive the abrasive sands of time. More probable: Internet came, there were free and far better applications which I could use and there remained no reason to struggle with my own code.
Things That Shape Our Lives
One curious soul, one limited microcomputer and the constraints set in place, a brilliant mind saying that things typically considered to be “rough”, a “mess”, or “chaotic”, such as clouds or shorelines, actually had a “degree of order”. He coined the term “fractal geometry”, discovered M-set in 1979-1980 and I followed his steps. Not because I was a genius, obviously. I already talked about the math situation. But the output was so beautiful, I could do nothing but follow, fail, try again until the magic emerged.